In all, brands will spend $150B+ in 2019 on sports sponsorship and activation worldwide. (1) Sponsorship typically accounts for ~20% of a large brand’s marketing budget, with some brands like AB InBev and Pepsi spending north of $350M each year on sponsorship investments. With such a significant spend, these brands need a way to measure the return on this investment and track how well each sponsored entity is promoting their brand.
What is a Promotional Effectiveness Score and why is it needed?
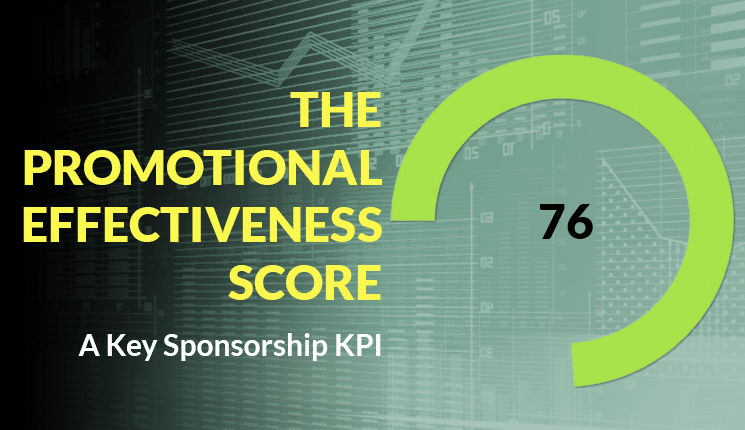
The Promotional Effectiveness score, pioneered by Hookit, tracks how effective an athlete or sports property is at promoting their partner or brand through social and digital media. It is a composite score out of 100 that looks at posting habits, content creation, and fan/follower engagement on promoted content. It is a way to compare entities on a level playing field by examining the quality of their promoted posts, the frequency with which they are promoting, and how their promoted content performs relative to the rest of their content.
There are always ways for the entities to improve his/her scores, which then creates better promotion of the brand. The higher the score, the more effective the promoter. Brands can use this score to understand which entities are promoting their brand the best and which have room to improve.
What goes into the Promotional Effectiveness Score?
Each sub-score provides actionable insights into how each property could be a better promoter of that brand.
Sub Scores:
Posting habits
- Post Proportion: What is the entity’s proportion of promoted to non-promoted content?
- Frequency: How often does the entity post promoted content?
Content creation
- Quality: What is the quality of promotion in the promoted posts? (based on promotion quality scores derived from the Hookit Valuation Model)
- Share of Voice: How many other brands are being mentioned in their promoted posts?
Follower/fan engagement
- Engagement Score: How much engagement the entity’s promoted posts are driving compared to their non-promoted posts?
Each sub-score is then compared to the distribution of that sub-score across the Hookit Sports Graph that tracks nearly every entity in sport and then fit to a score between 0 and 100. The overall score is the average of each subscore weighted equally. Below is a graphic showing the sub score breakdowns.

How is this score used by brands?
- First, the score reveals how effective of a promoter an entity is
- Second, the score shows a brand where their sponsored entity can improve. For example, in the comparison above, Lebron James could improve his Promotional Effectiveness score for Nike if he had higher quality promotions. To do this, he would need clearer Nike logos in his posts as well as proper mentions of @nike or branded hashtags like #justdoit.
- Third, the score allows brands to compare different entities’ promoting skills to know which ambassadors and sports properties are good investments and which are not likely to return high value for the brand through social and digital promotion
While the Promotional Effectiveness score is an excellent indicator of which properties are the best partners for a brand, there are other factors that need to be considered in combination with the score. For one, the PE score does not consider the number of followers than an entity has. If two properties have similar PE scores, a brand would be better served to partner with the one with the larger follower size as that will generate a larger impact for the brand. Similarly, the demographics and audience make up of that following need to be considered. A property could be an excellent promoter, but not have the target audience that the brand wants to reach. If this is the case, the brand would be better served to find another property to partner with, even if they have a slightly lower PE score.
To see how the Promotional Effectiveness score can be used to evaluate the performance of a brand’s sponsorship portfolio, take a look at this deep-dive report into the financial segment and which banks, insurance companies, and financial organizations are getting the most out of their sponsorship portfolio.
(1) IEG Sponsorship Report


